Analytics Overview
The Analytics Overview screen has the following features:
All reporting features are available to Jira administrators and members of groups who have been given access in the Configuration Reporting screen screen.
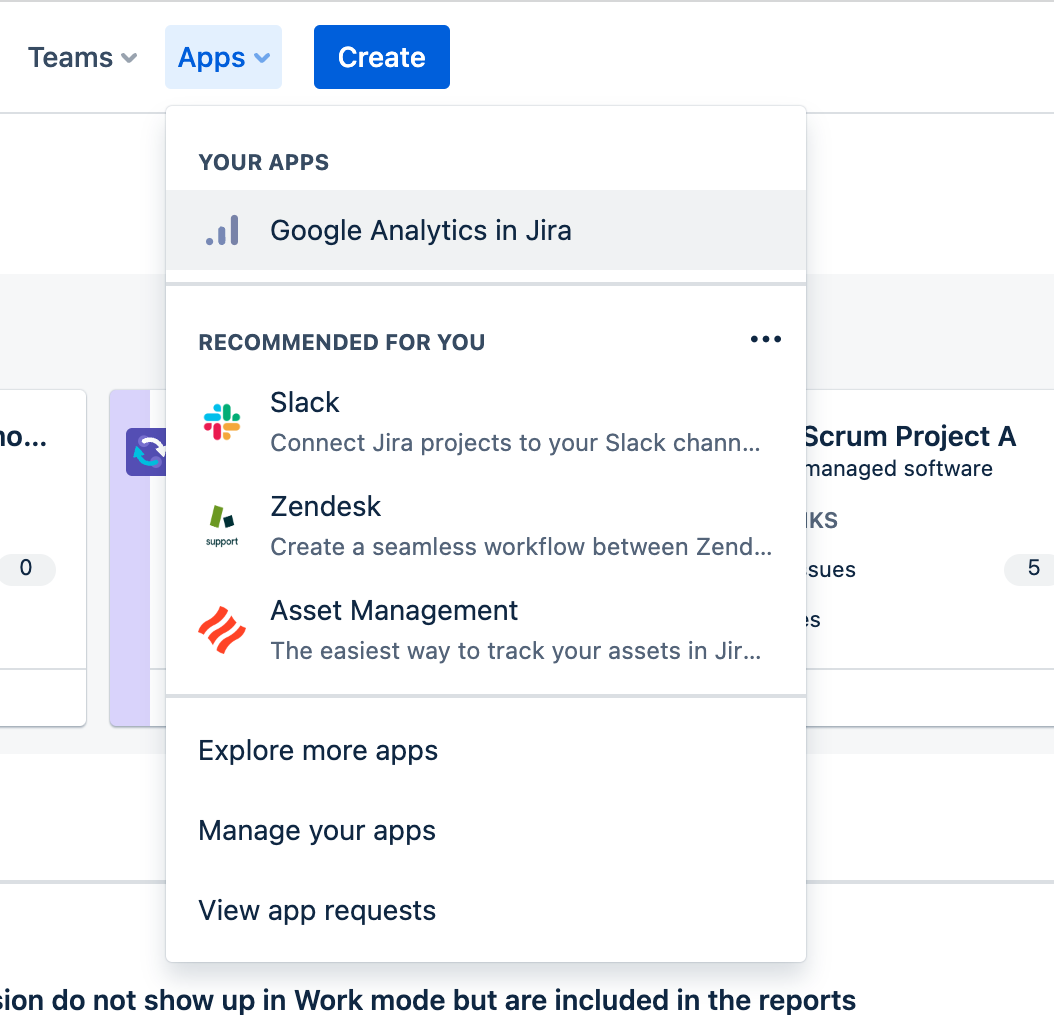
The analytics overview screen is accessed from the Apps dropdown menu in the Jira header
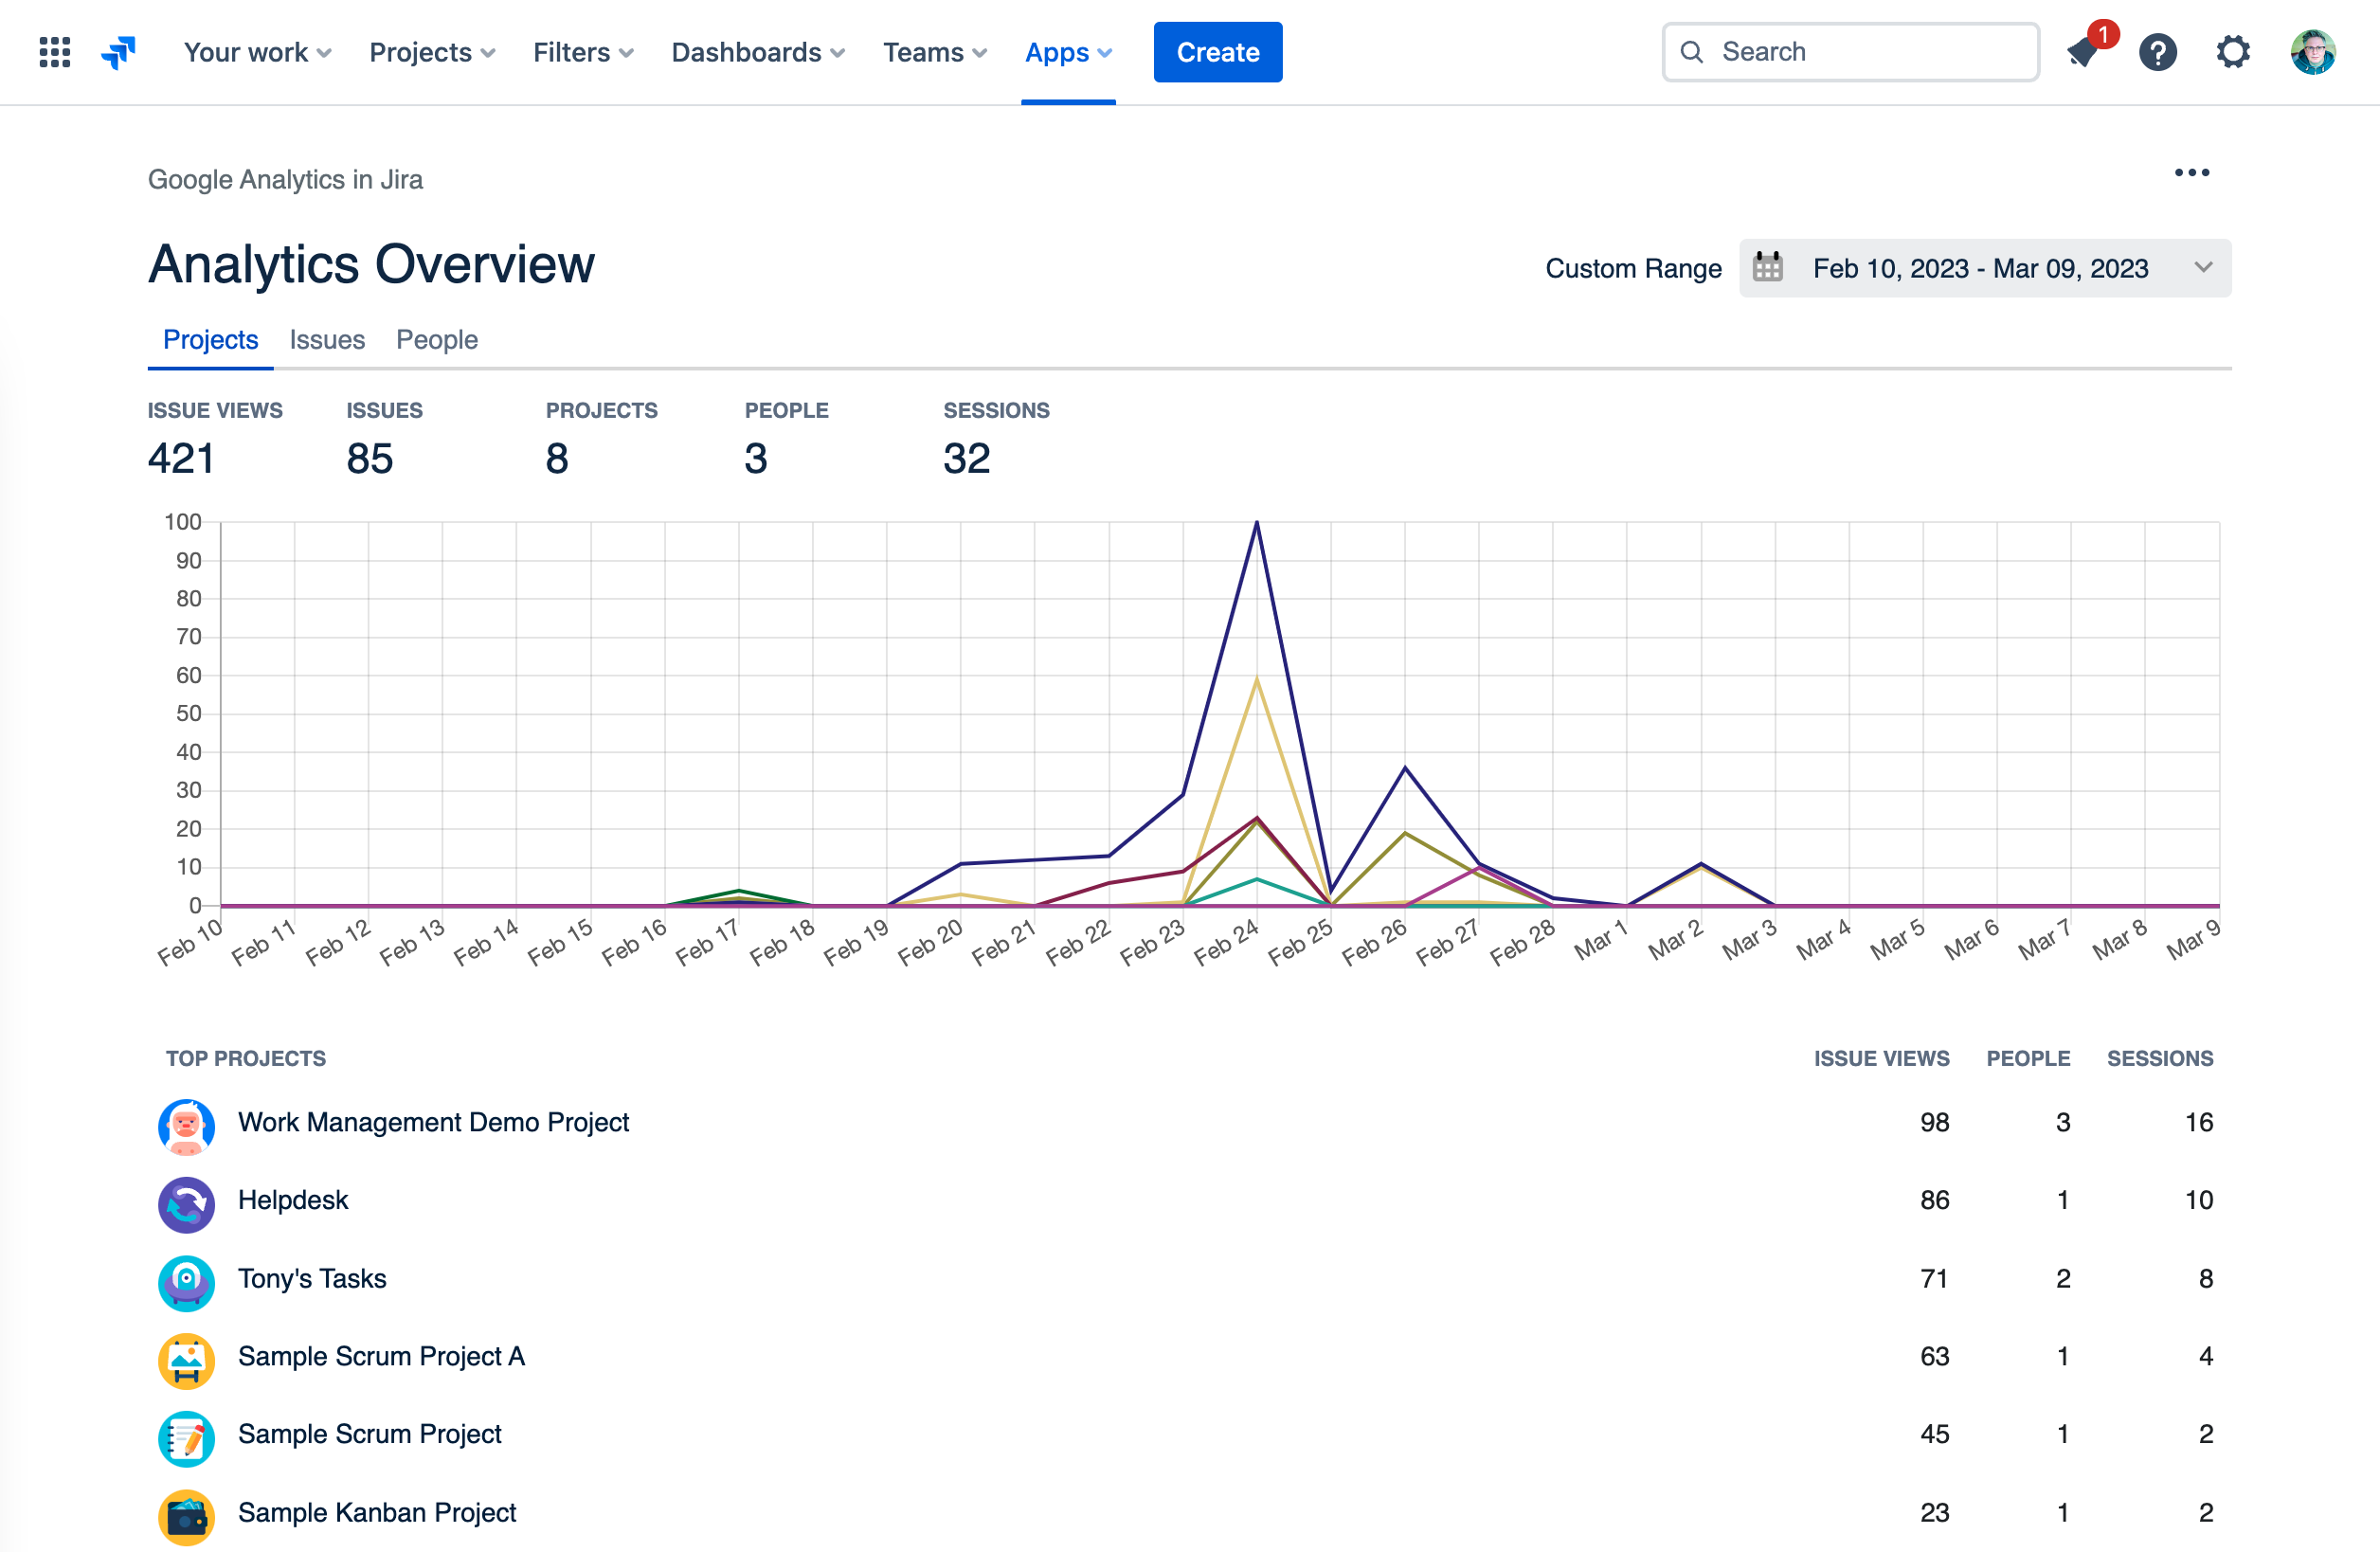
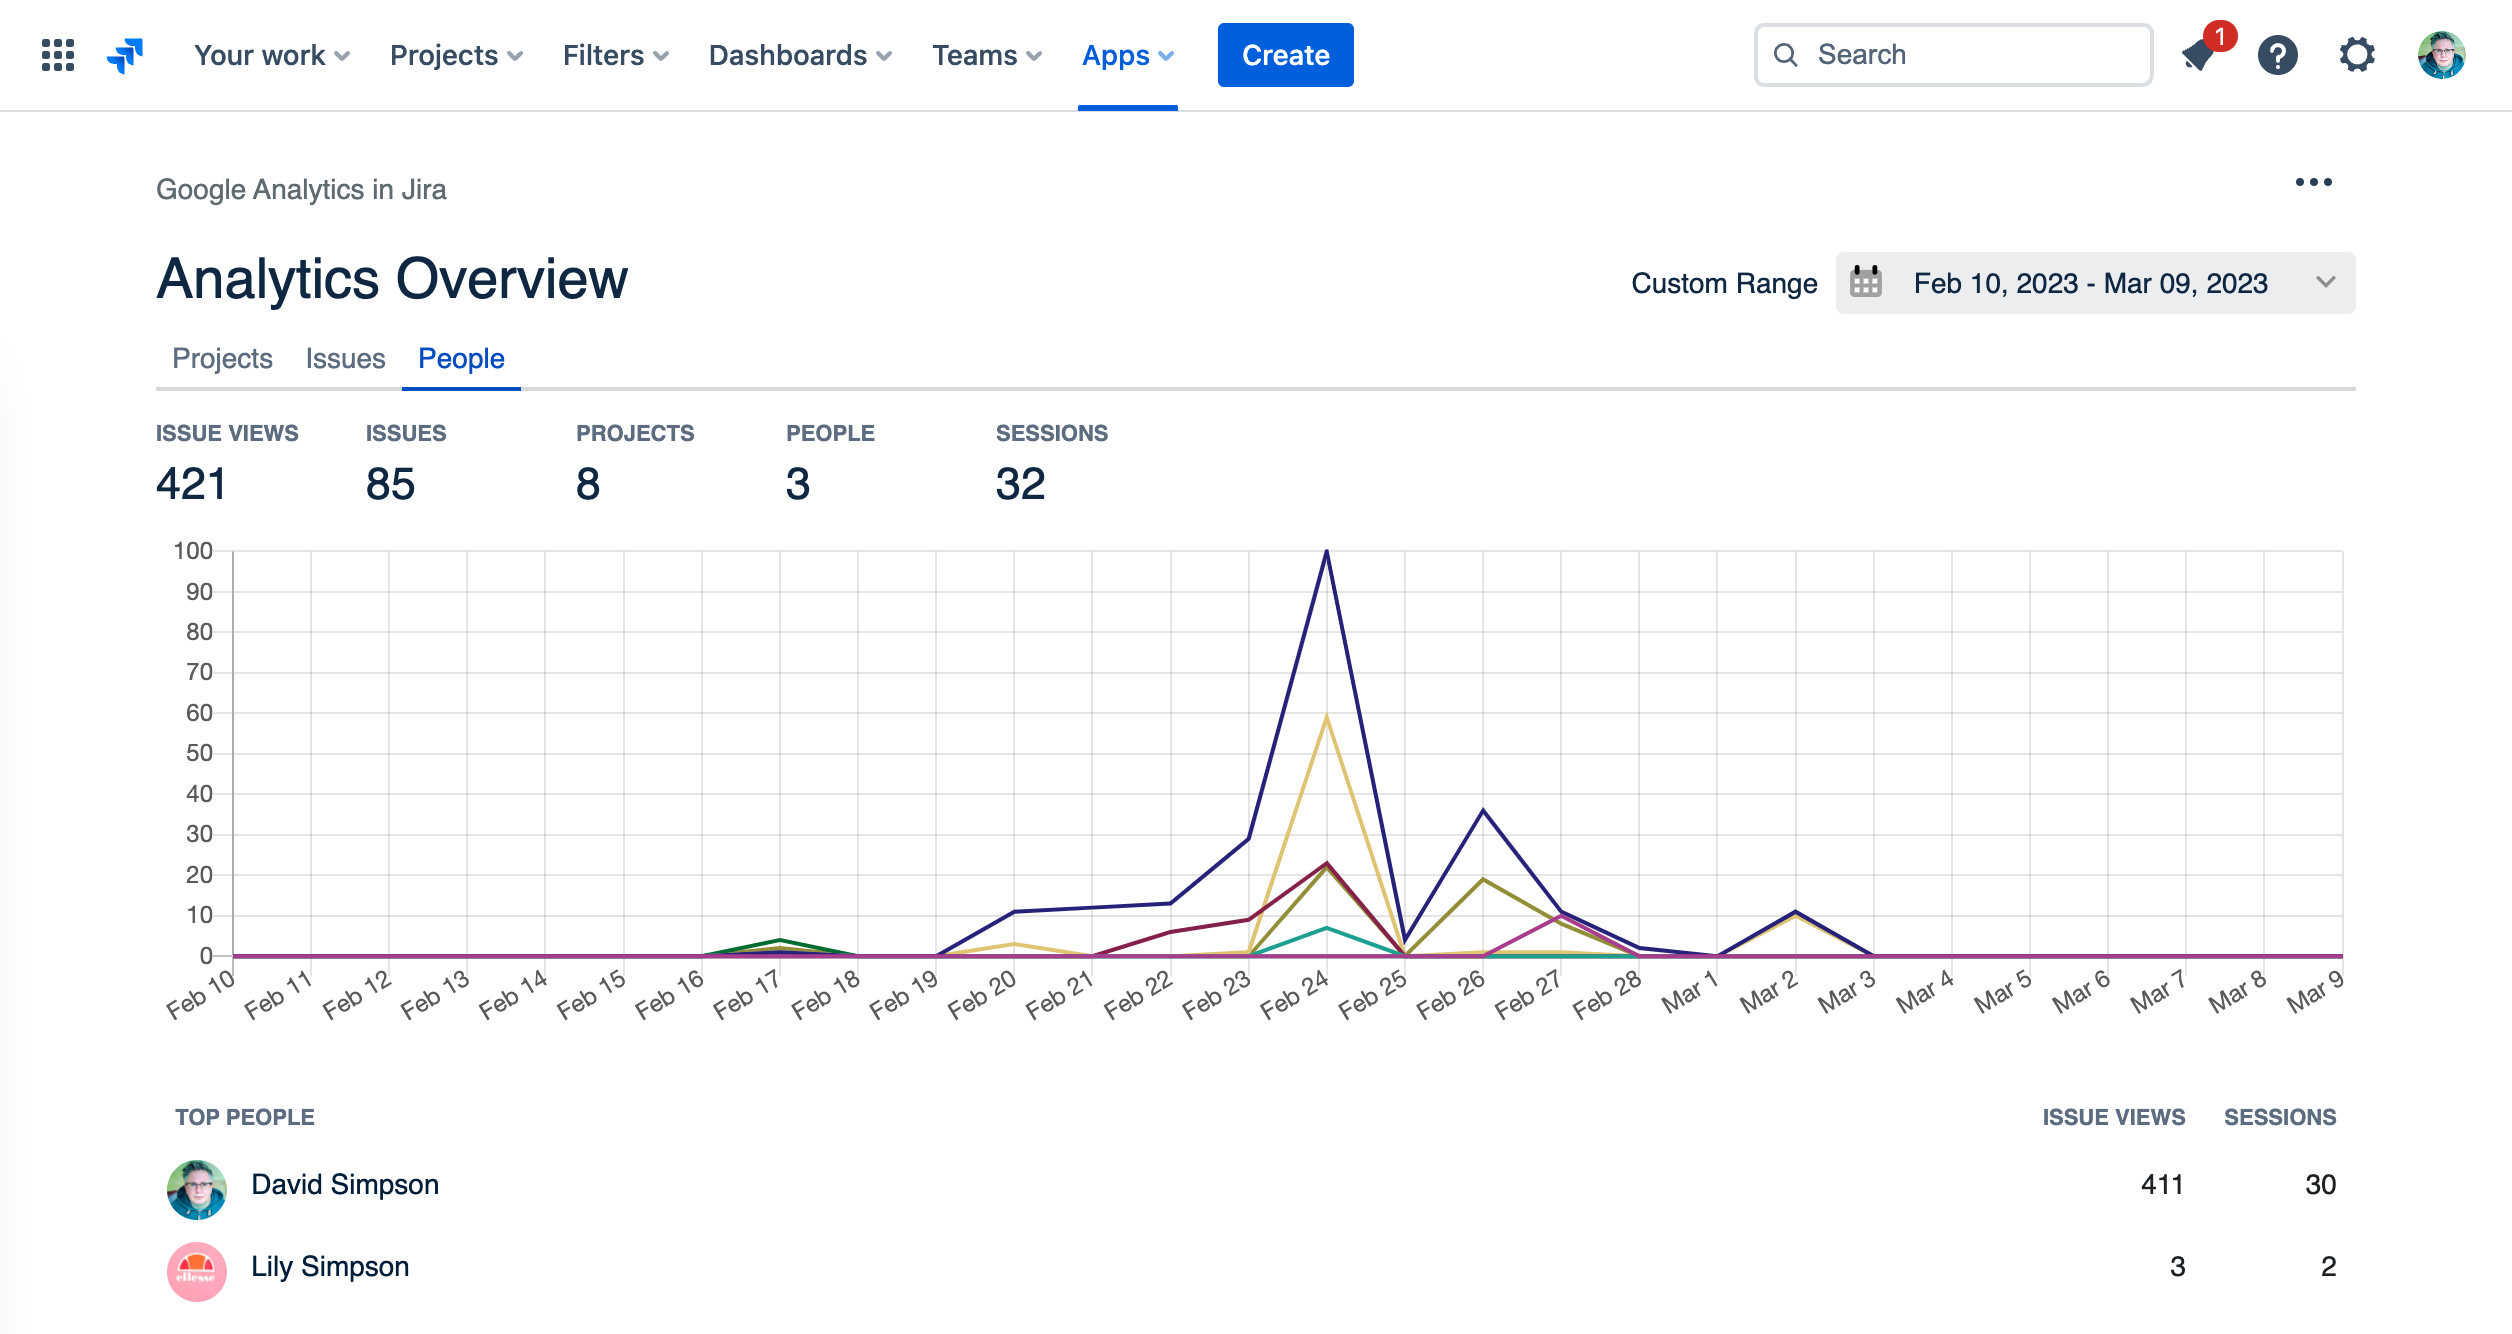
Headline figures
For the selected time period, this provides:
Issue Screen Views, No. of Issues Viewed, Portal Views NEW , No. of Projects Viewed, People & Sessions

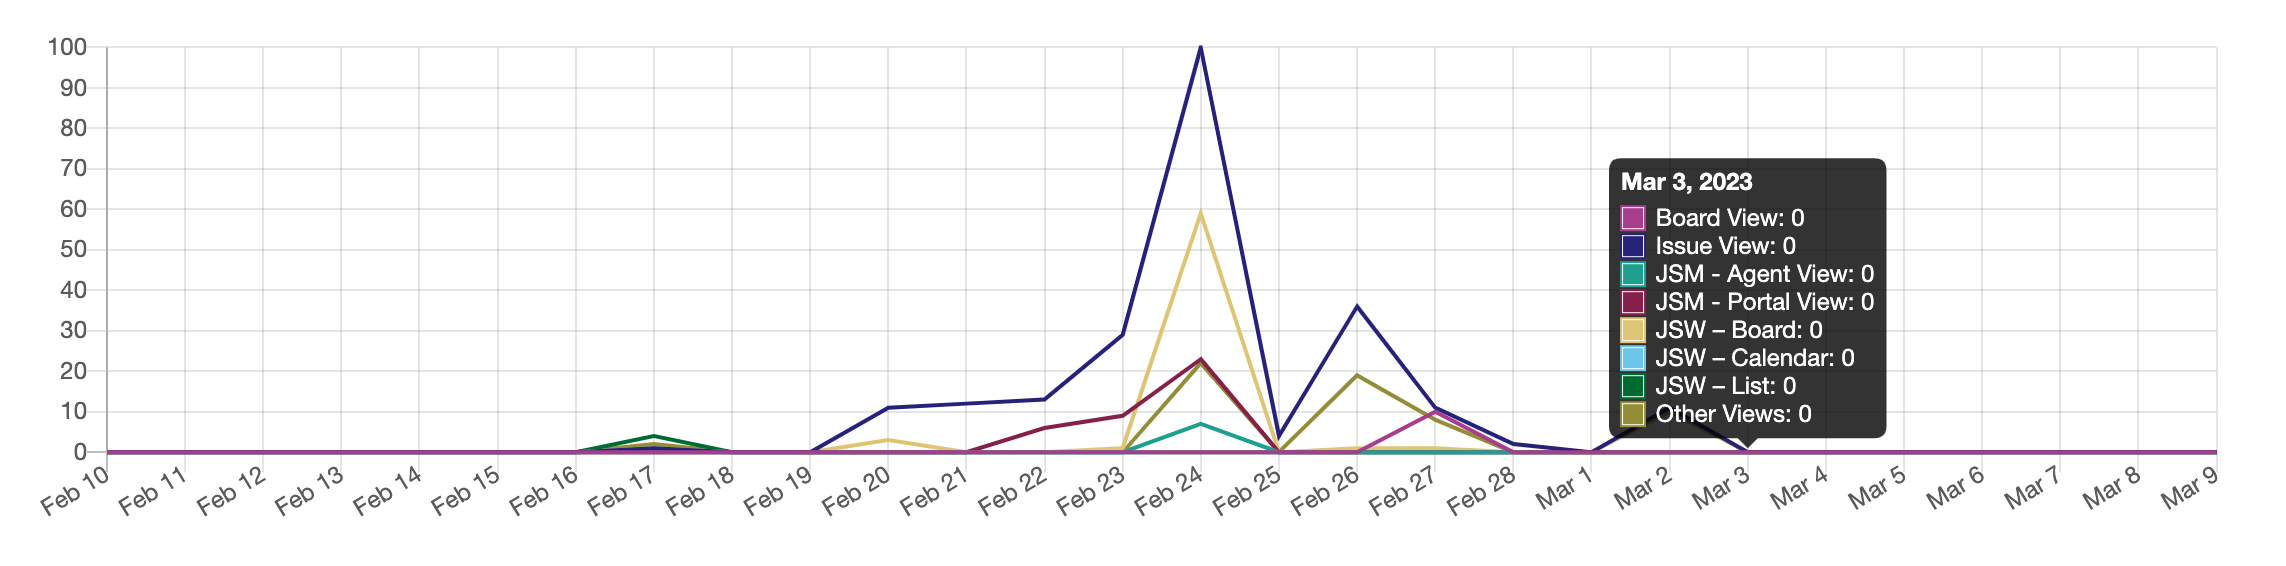
Usage over time
Issue screen views broken down into the various contexts
Board View & Issue View
Jira Service Management Views
Agent Views & Portal Views
Jira Work Management Views
Board, Calendar& List Views
Any other issue view
All timelines are colour-blind friendly with accessible colours being used
Projects Report
Issue Views, People & Sessions
Each project listed is a link to the Project Analytics report for the project
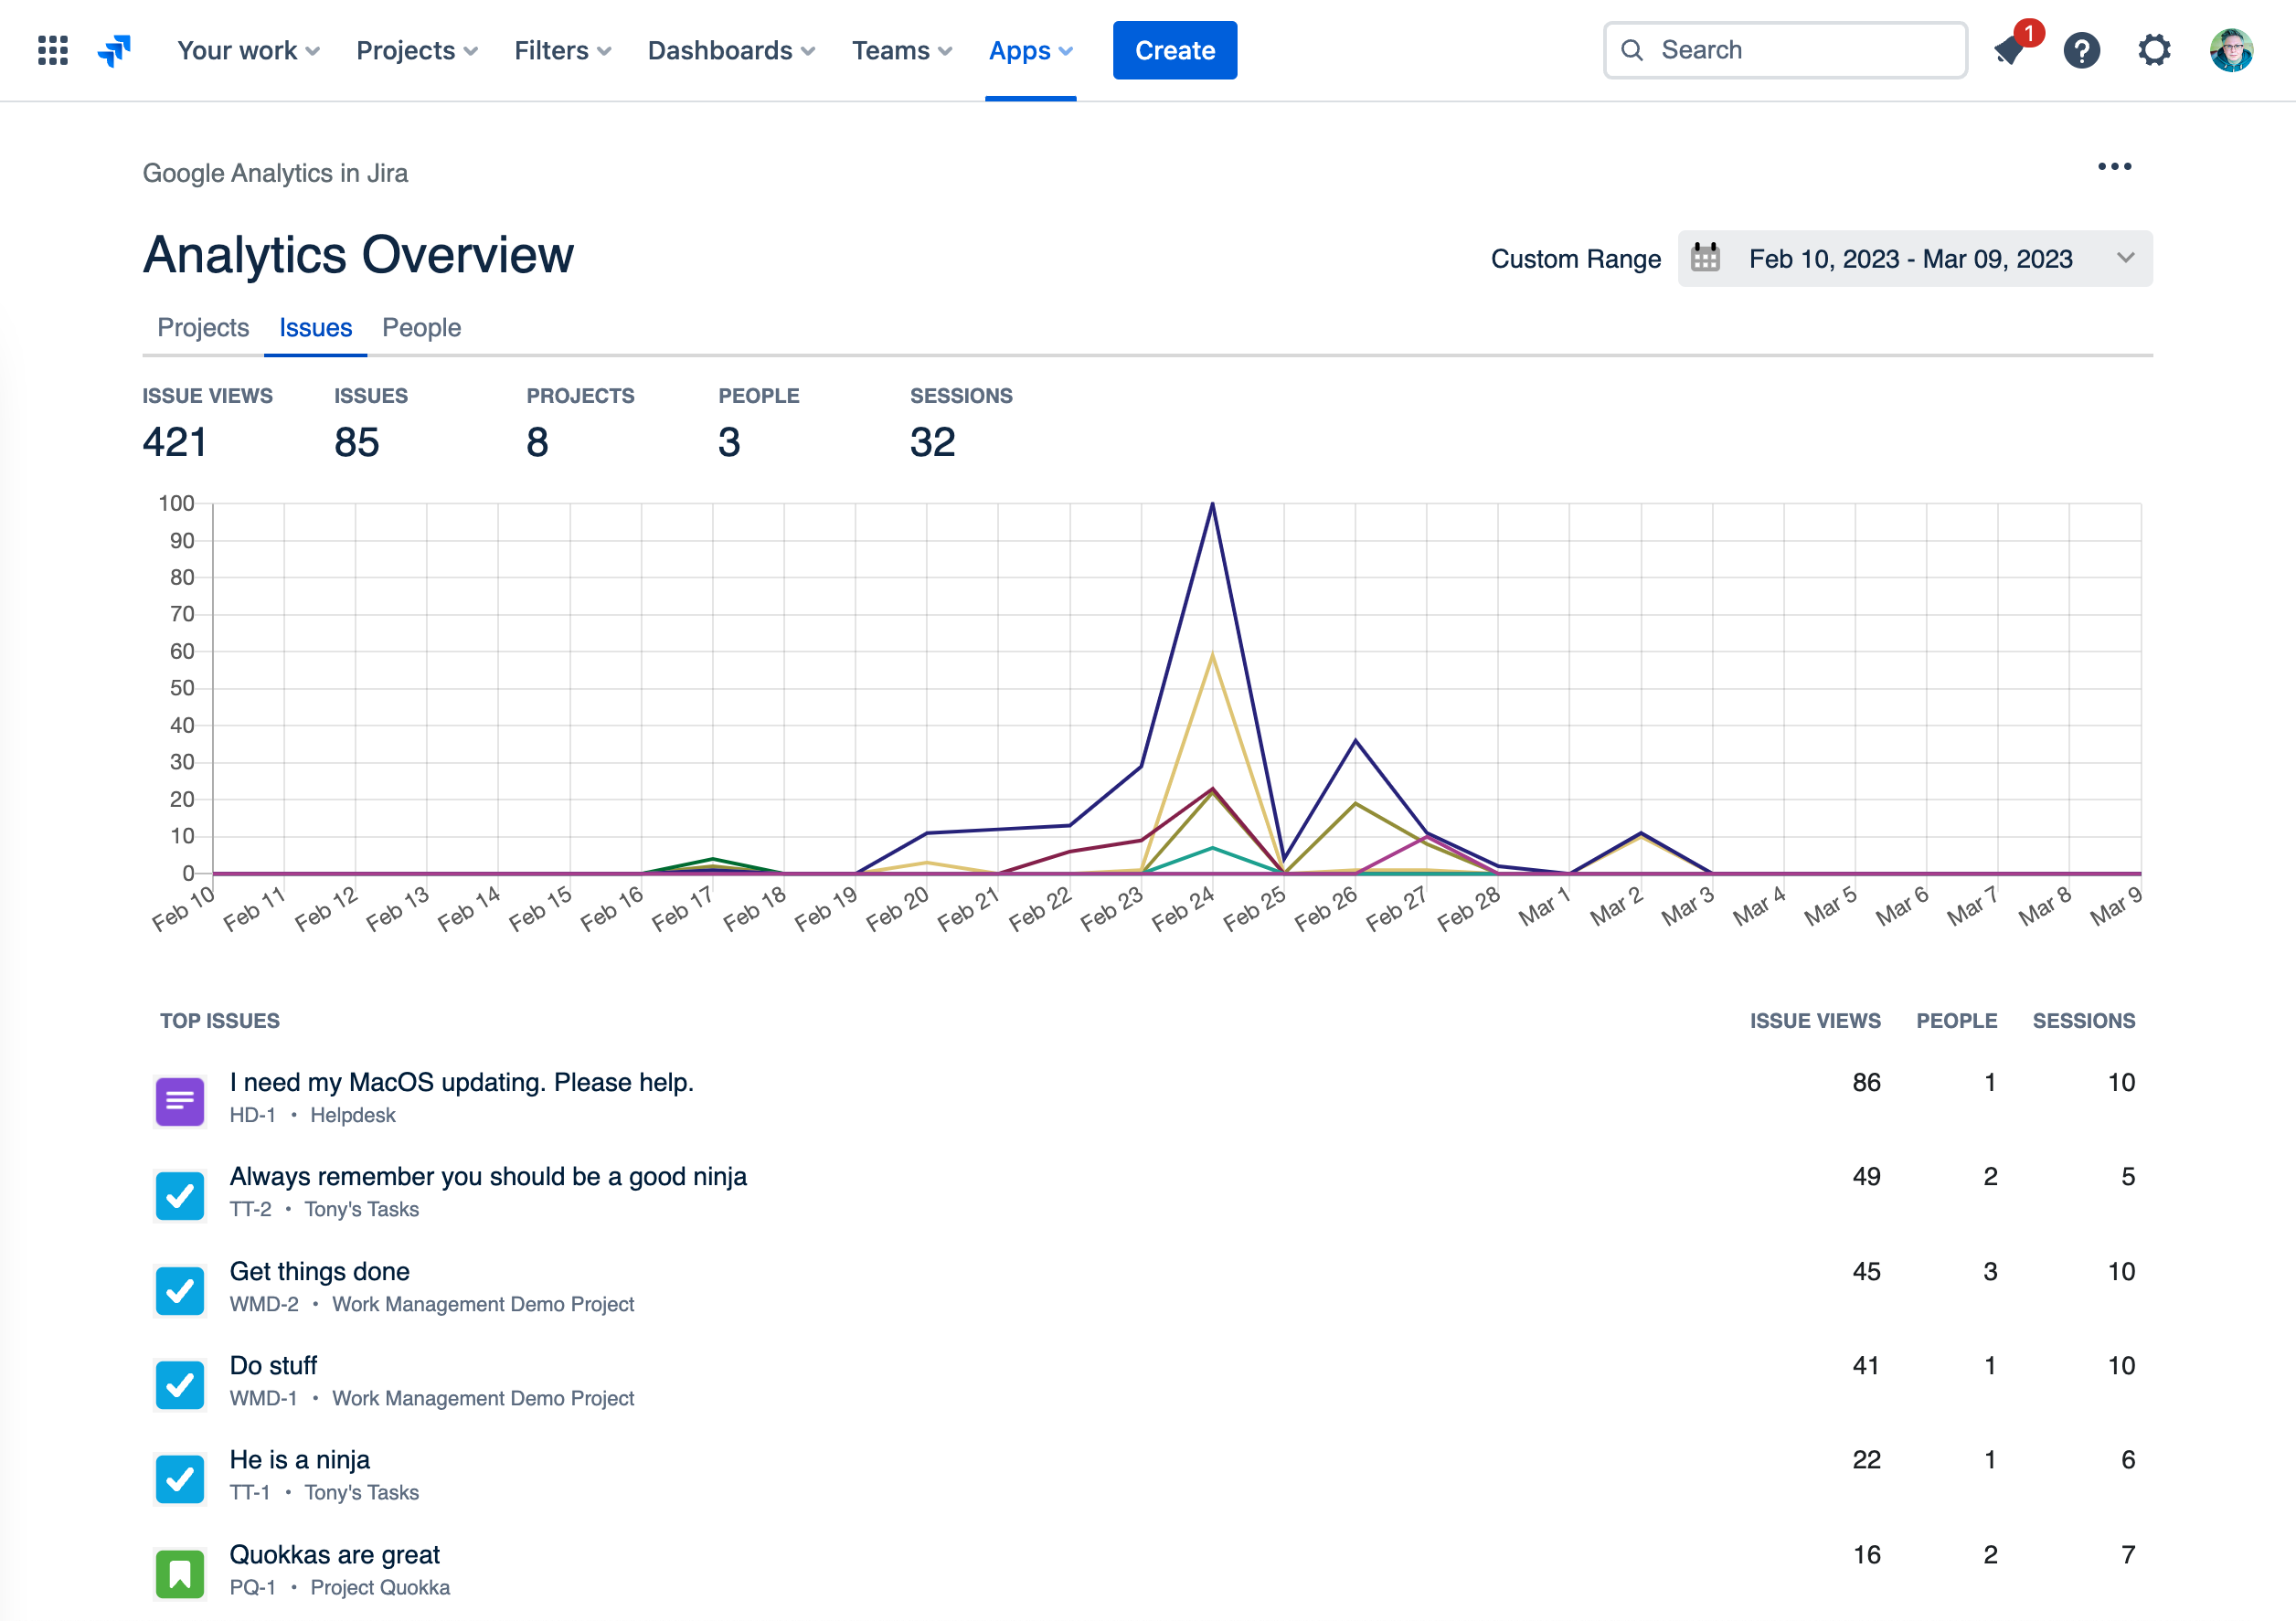
Issues Report
Issue Views, People & Sessions
Each issue listed is a link to the Issue Analytics report for the issue
People Report
Showing views and also their editing contributions…
Issue Views & Sessions
Each person listed is a link to the People Analytics report for that person
JSM Portal Report
Reporting for all JSM Portal screens except Portal articles – these cannot be track using Google Analytics in Jira, instead use Google Analytics in Confluence
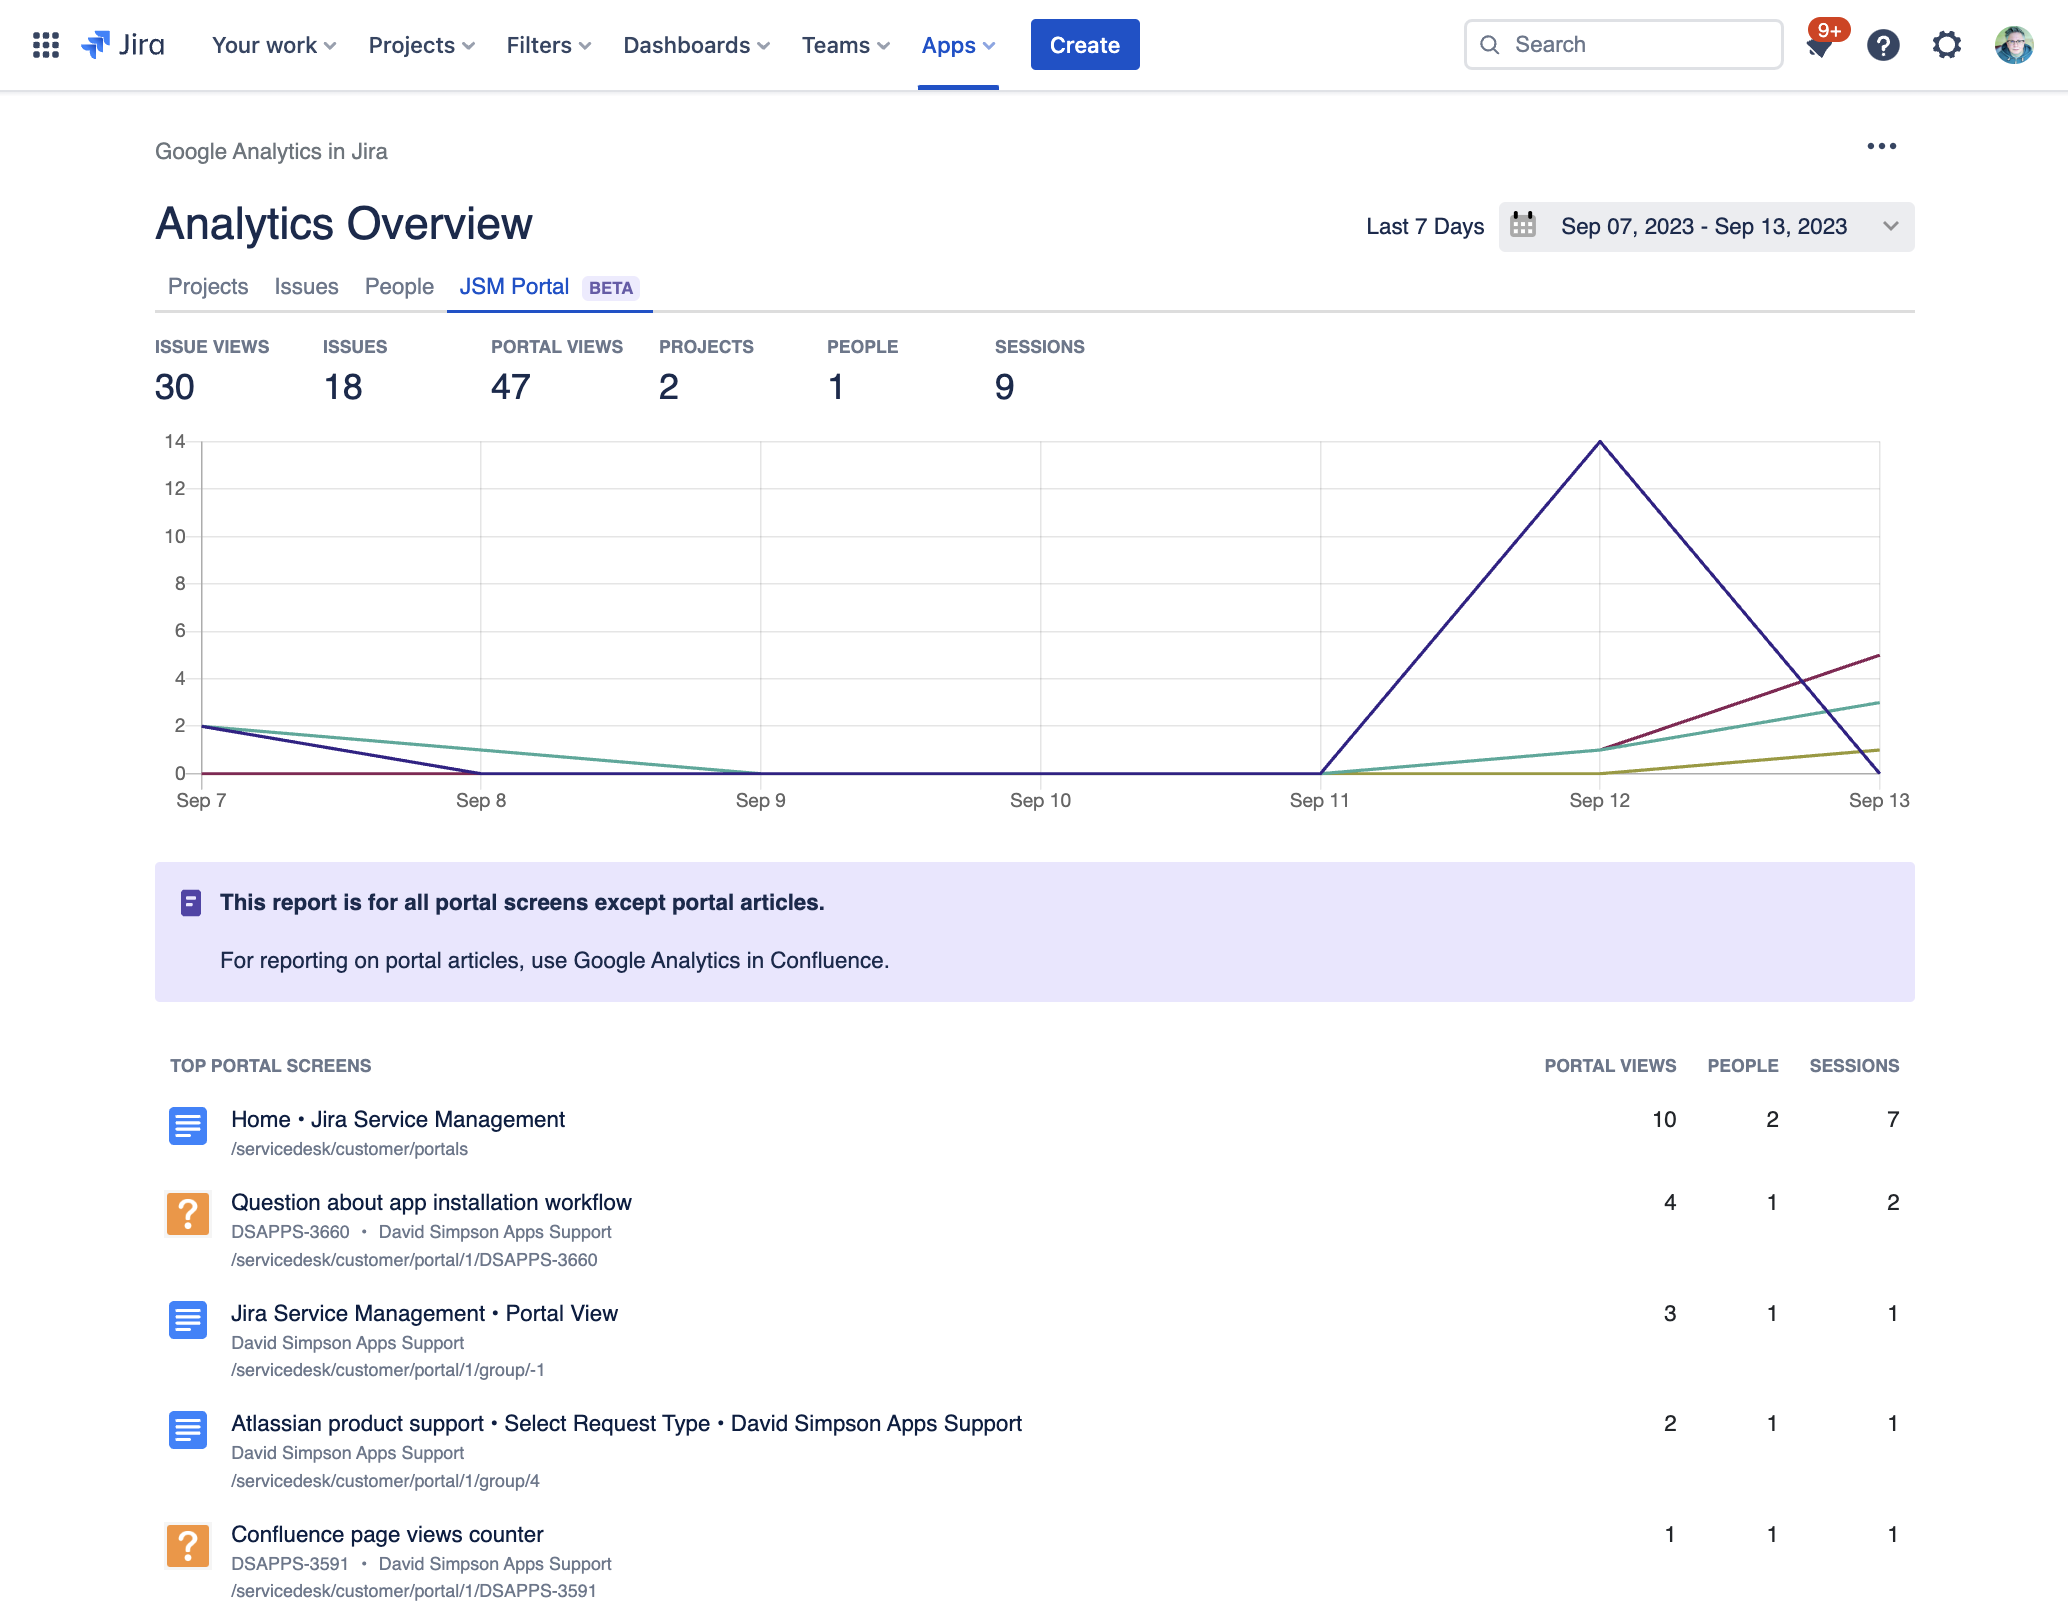
Note: The JSM Portal Report will only be displayed if you have a current license for Jira Service Management
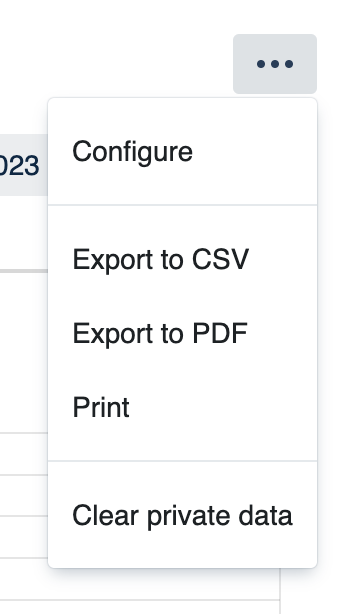
Tools Menu
For admins, gives access to the configuration screens
Gives export options – CSV, PDF or Print
Clear private data – Removes reports data cached in the browsers' localStorage
Date picker
Allows you to select the date range required
