Skip table of contents

How do I know that Google Analytics is tracking my site?

Basic troubleshooting

Disable content blockers

Content blockers such as AdBlock Plus, Ghostery, DuckDuckGo Essentials and Privacy Badger  may prevent the page from loading the Google Analytics script and therefore prevent tracking completely.

Disable these before you start troubleshooting.

Check the Realtime report in Google Analytics

  1. In Confluence, browse some pages after setting up Google Analytics tracking

  2. In Google Analytics, browse to the Realtime report

    • If you have configured Google Analytics correctly, you should see some activity from your home town in the Realtime report:
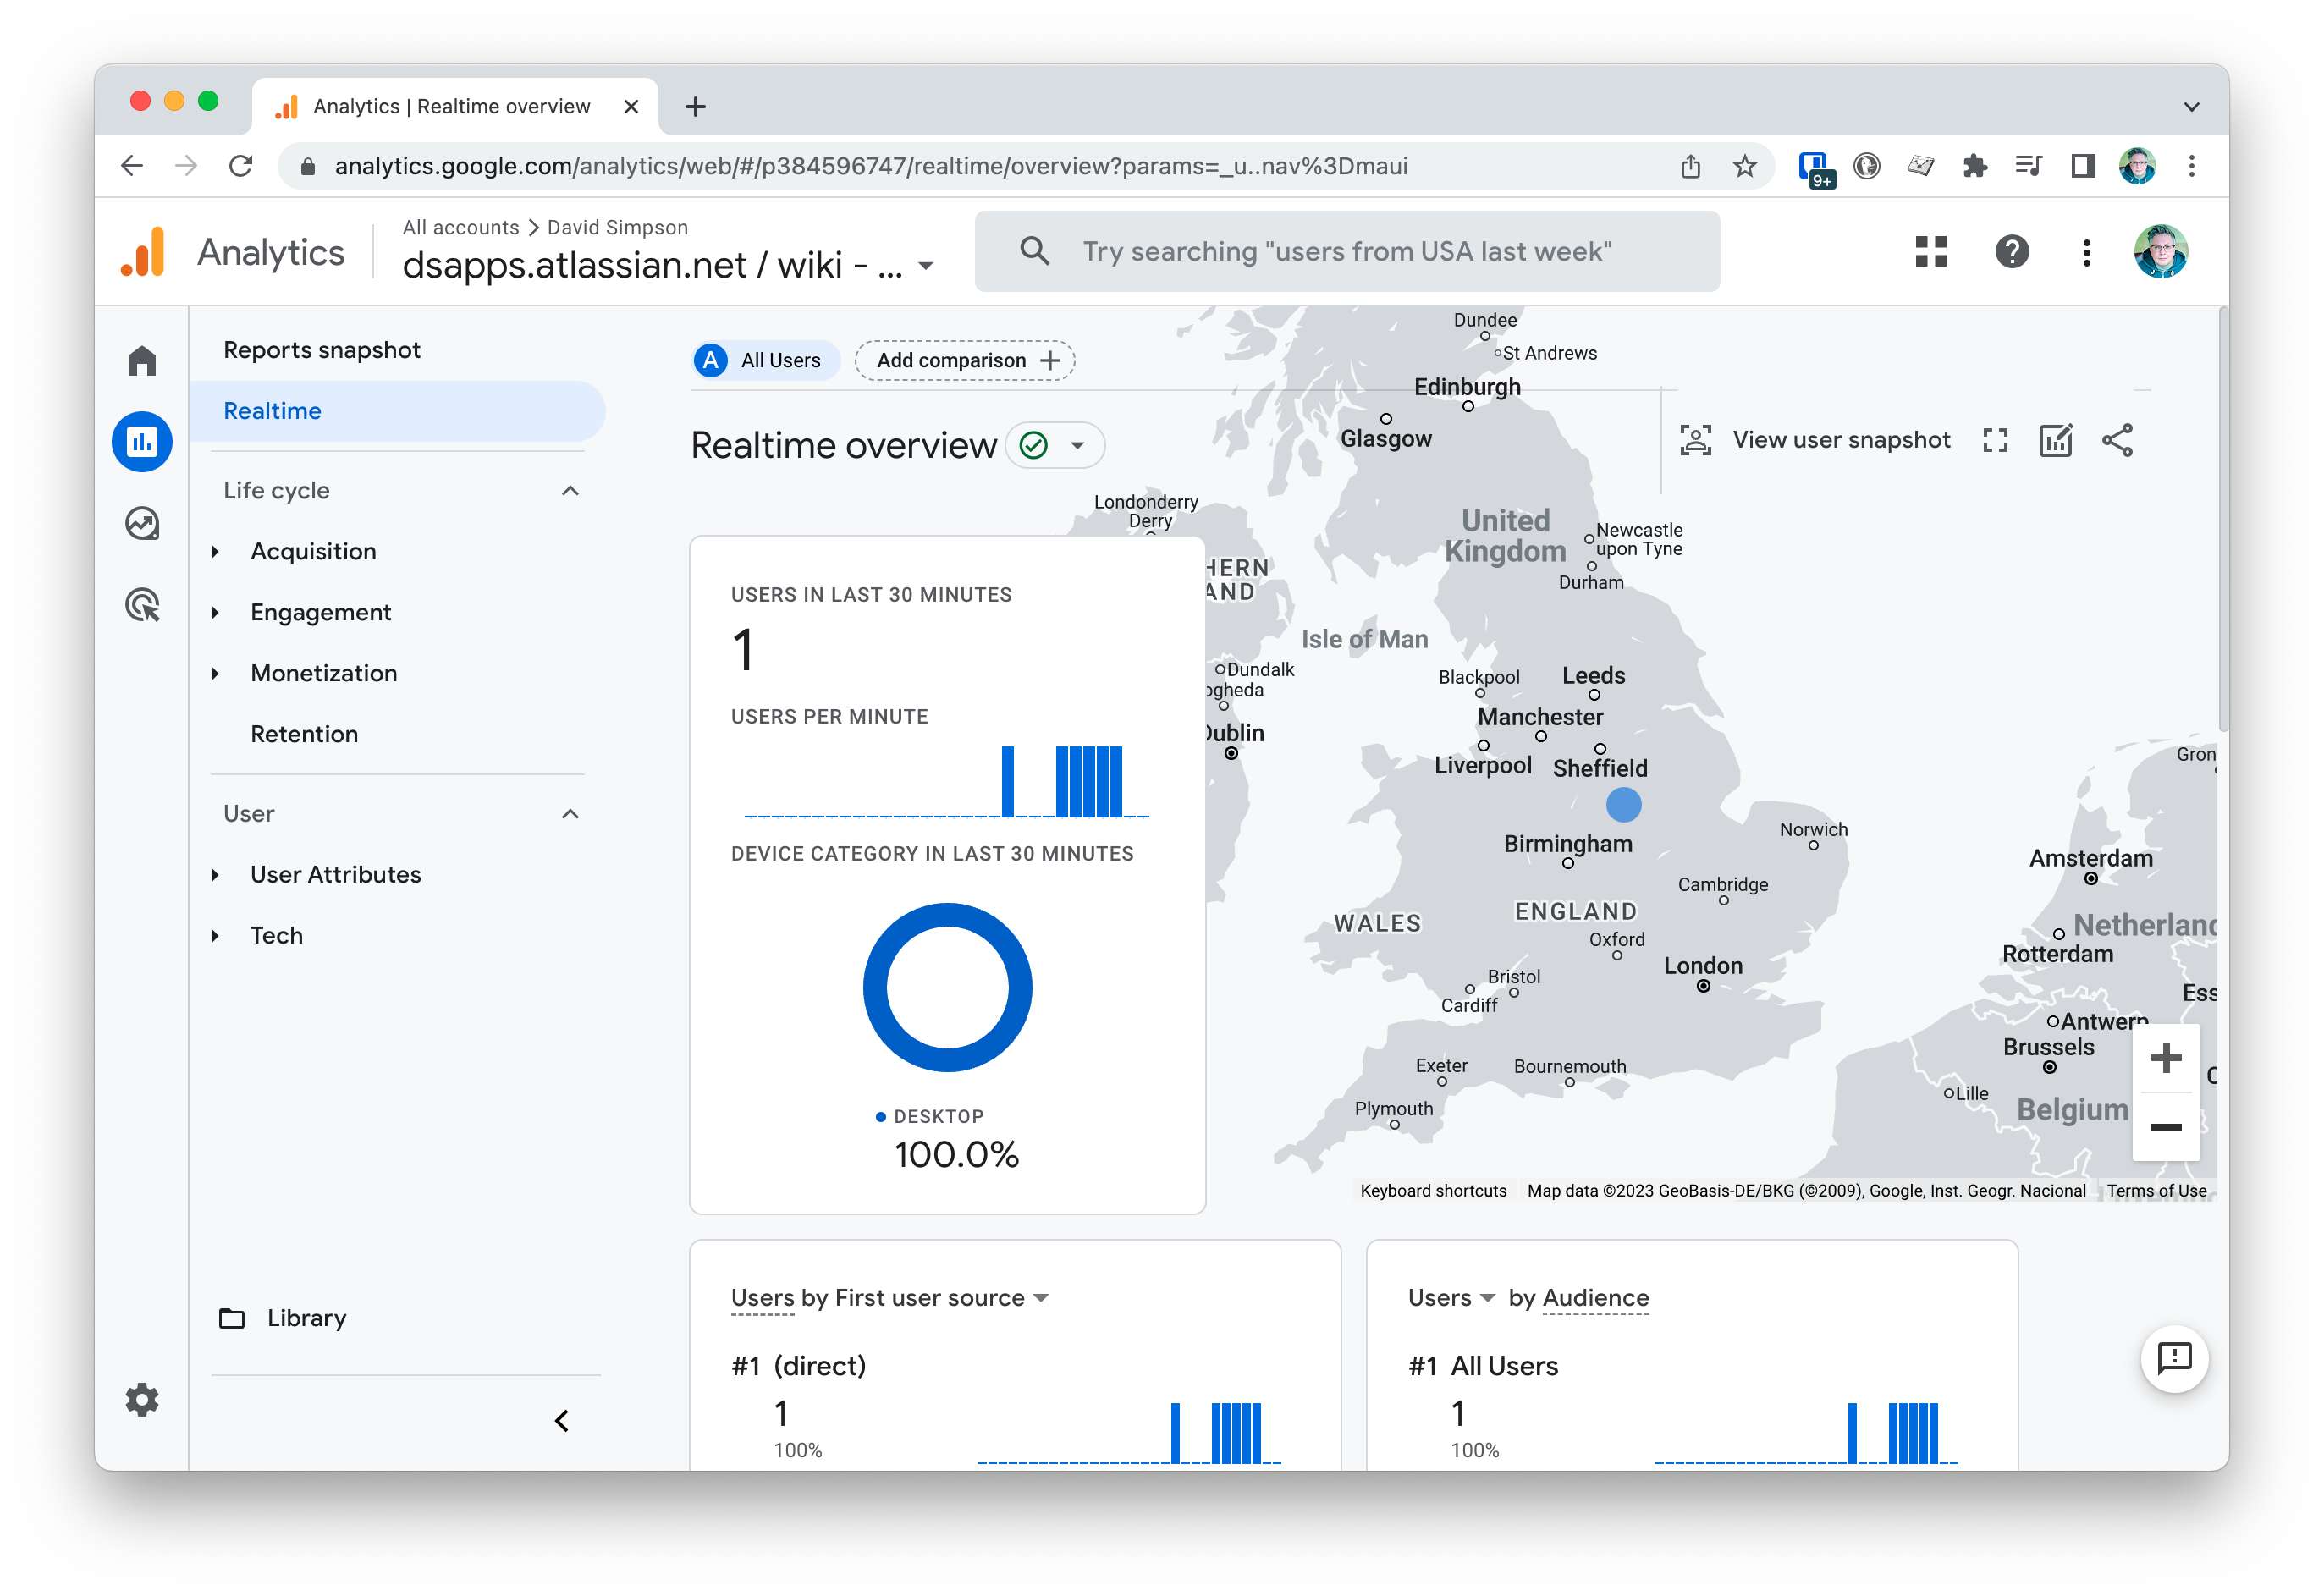
Google Analytics Realtime report

Advanced troubleshooting

Check the console

Having successfully configured the app, you'll want to be sure that the tracking beacon is being correctly sent to Google Analytics.

The simplest way to test for this is to open up your browser's developer tools or web console and look for either of the following lines:

After July 2023, only the second line should be present.

If this line is present, the app should be correctly sending the tracking beacon to Google Analytics. However, if you have a content blocker enabled, this may prevent the Google Analytics script from loading.

How to access the console

Chrome

To open the developer console window on Chrome, use the keyboard shortcut Cmd-Shift-J on Windows or Cmd-Option-J on a Mac.

Edge

To open the console on Edge, hit F12 to access the Developer Tools. Once in the Developer Tools, navigate to the Console tab.

Firefox

To open the console on Firefox, use the keyboard shortcut Cmd-Shift-K on Windows or Cmd-Option-K on a Mac. The toolbox will appear at the bottom of the browser window, with the Web Console activated.

Safari

To open the console on Safari, you will first need to turn on the Develop menu. To do this, open the Safari menu in the Mac menu bar, then select Preferences. Once in the Preferences dialog, navigate to the Advanced tab, then check the "Show Develop menu in the menu bar" box.

Once the Develop menu has been enabled, you can go to the Develop menu in the menu bar and then select the "Show JavaScript Console" option. The JavaScript Console will show up on the bottom half of the active browser window.

Advanced troubleshooting

Open the browser console, and then reload the page.

Search for /collect in the filter box.

If you have both UA & GA4 configured (before July 2023), there should be 4 data collection calls to the Google Analytics APIs.
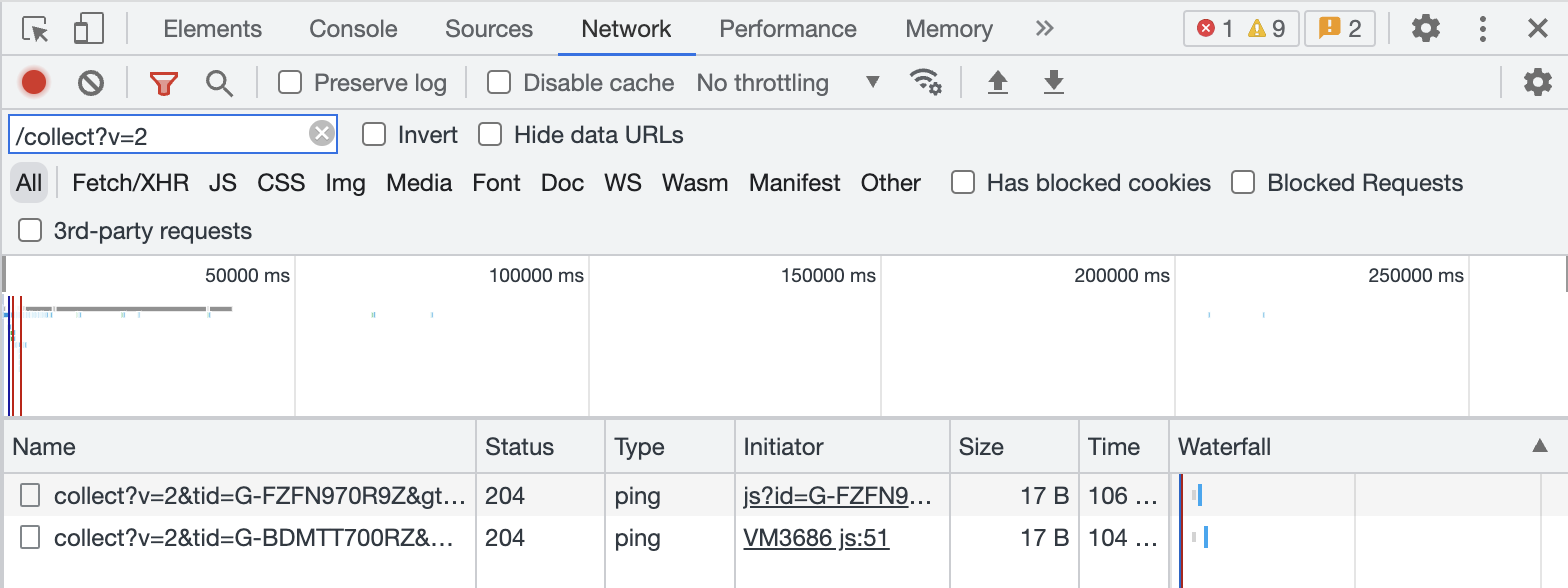
Searching for /collect?v=2 shows you hwo the network calls will work after July 2023 – there should be 2 data collection calls to the Google Analytics APIs.


JavaScript errors detected

Please note, these errors can depend on your browser setup.

If this problem persists, please contact our support.